Five Myths About Women Homebuyers and What the Data Really Shows
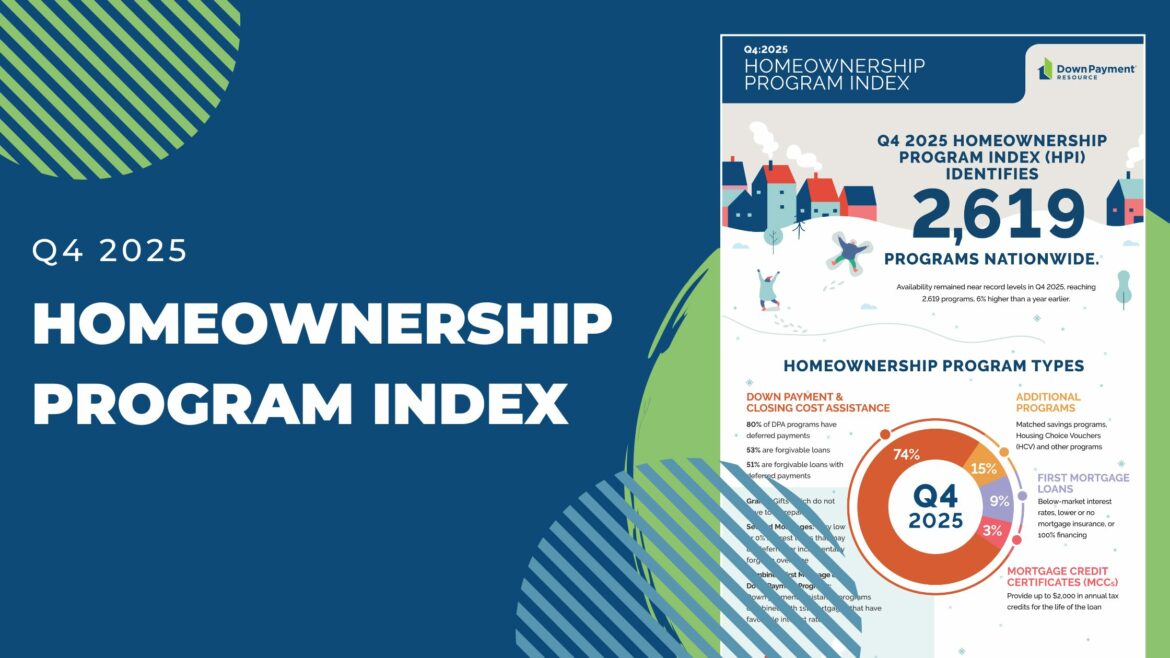


Down Payment Resource (DPR) has released its Q4 2025 Homeownership Program Index (HPI), identifying 2,619 homeownership programs nationwide. While the total number of programs decreased by five from the prior quarter, availability remained near record levels and finished 6% higher than a year earlier, rising from 2,466 programs in Q4 2024. The year-over-year (YoY) growth of 6% reflects continued expansion and refinement of program options as affordability challenges persist.
With an average benefit of approximately $18,000, down payment assistance remains a critical tool for helping lenders qualify mortgage-ready buyers. On average, assistance reduces a borrower’s loan-to-value ratio by 8.8%, strengthening loan profiles and expanding access to credit. Many programs also support closing costs, prepaid expenses, mortgage rate buydowns and reductions in mortgage insurance costs. Some buyers are able to layer multiple programs to further improve affordability.
Every U.S. county has at least one homeownership program, and more than 2,000 counties have 10 or more such programs. California continues to lead with 353 programs from 223 providers, followed by Florida with 196 programs from 128 providers and Texas with 128 programs from 63 providers.
A total of 1,599 programs, or 62%, have average income limits exceeding $100,000 across their coverage areas. In addition, 270 programs, or 10%, have no income limits, representing a 15% YoY increase and expanding the pool of eligible buyers.
The City of Greenville – West Greenville/University Program offers a 10-year forgivable loan for up to 5% of the purchase price (not to exceed $10,000). There are no income limits, but applicants under 80% of the Area Median Income (AMI) may qualify for additional funds. There are no caps on the purchase price of the home. Funds can be used for down payments and/or closing costs.
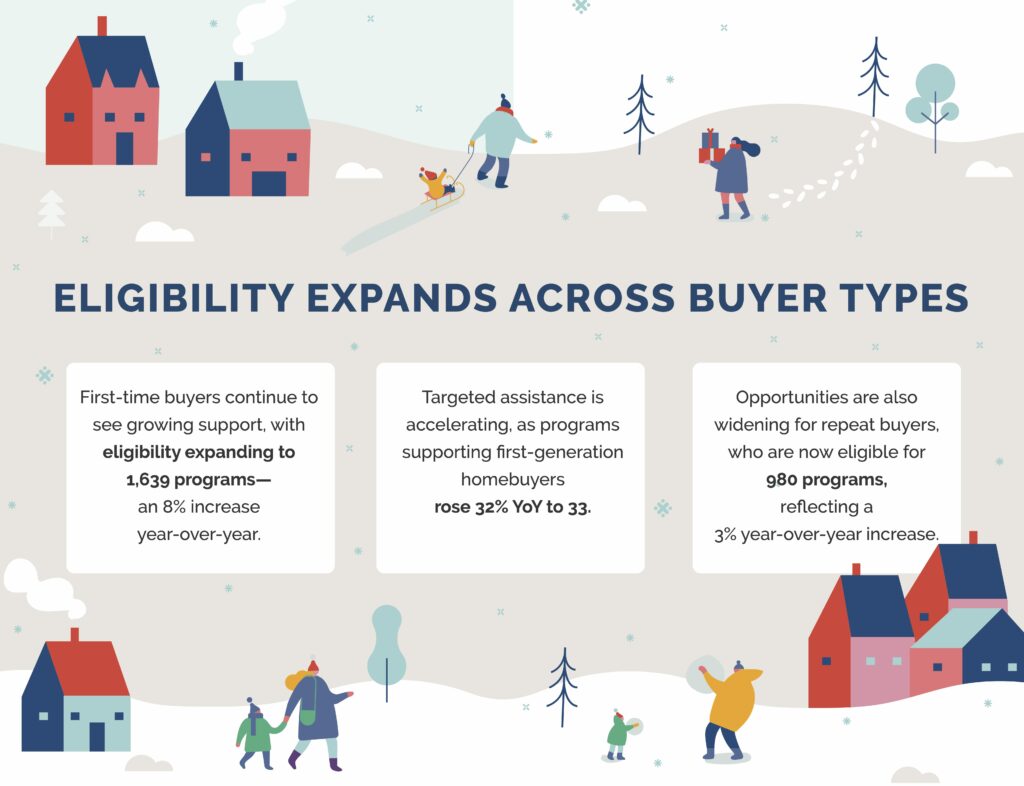
First-time buyers are eligible for 1,639 programs, representing an 8% YoY increase. Support for first-generation homebuyers increased to 33 programs, a 32% rise from the previous year. Repeat buyers are eligible for 980 programs, a 3% YoY increase. Servicemembers and Veterans are exempted from first-time buyer requirements by 246 programs, up 12% YoY.
South Carolina Housing’s First Generation Homebuyer Program offers support for first-time homebuyers whose parents did not own a home (first-gen buyers) in the form of a 15-year $10,000 forgivable loan to cover the borrower’s down payment, closing cost and prepaid items. There is a purchase price limit for the home of $450,000.
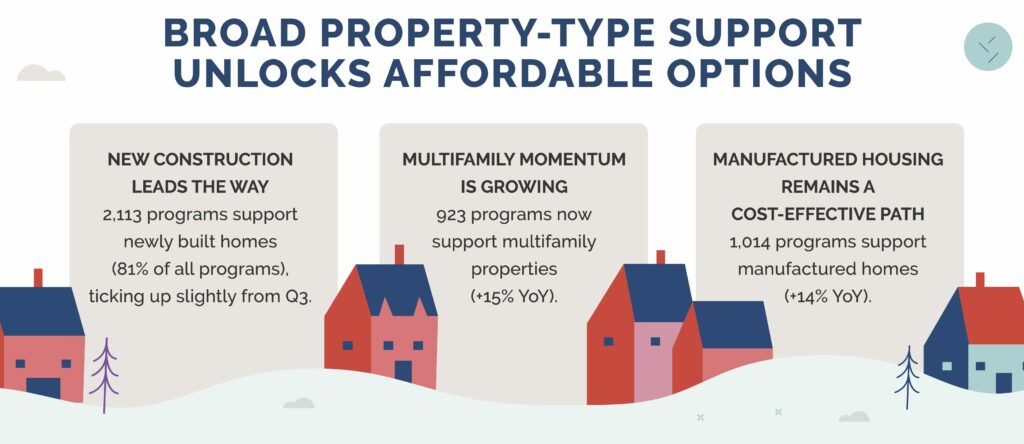
Newly constructed homes are supported by 2,113 programs, or 81% of all program options, a slight increase from Q3. Multifamily properties are eligible under 923 programs, a 15% YoY increase, including growing support for three-unit and four-unit properties.
Neighborhood Housing Services (NHS) of San Antonio Down Payment Assistance Program offers up to $20,000 to first-time buyers in the form of a 10 or 20 year low-interest repayable loan for first-time buyers of newly constructed homes, existing homes, two-unit multifamily homes, condos/townhomes and manufactured homes are eligible. Homebuyer income can be up to 120% AMI and a minimum credit score of 580 is required.
Buyers of manufactured housing are supported by 1,014 programs. While slightly lower quarter over quarter, support is up 14% YoY. According to the Manufactured Housing Institute, new manufactured homes cost approximately $85 per square foot, compared to about $166 per square foot for site-built homes.
Municipal and local agencies offer 1,027 programs, representing 39% of all program options (up 6% YoY). Nonprofit organizations sponsor 562 programs (up 7% YoY), while state housing finance agencies account for 466 programs nationwide.
A total of 201 programs offer special incentives tied to occupation or other characteristics. Educators are supported by 71 programs, Native American buyers by 56 programs and military Veterans by 54 programs, all showing YoY growth.
The City of San Bruno Employer (CA) Assisted Housing/Employee Home Loan can provide permanent, full-time city employees with a loan for up to 20% of a home’s purchase price, up to $140,000. There are no income or purchase price restrictions. The total amount financed, including any other mortgage financing, must not exceed 90% of the purchase price. The loan is due upon the sale, transfer of any interest, ceasing to use the property as a primary residence or failure to comply with the loan conditions.
Here is a breakdown of the homeownership programs added since Q3 2025 by assistance type:
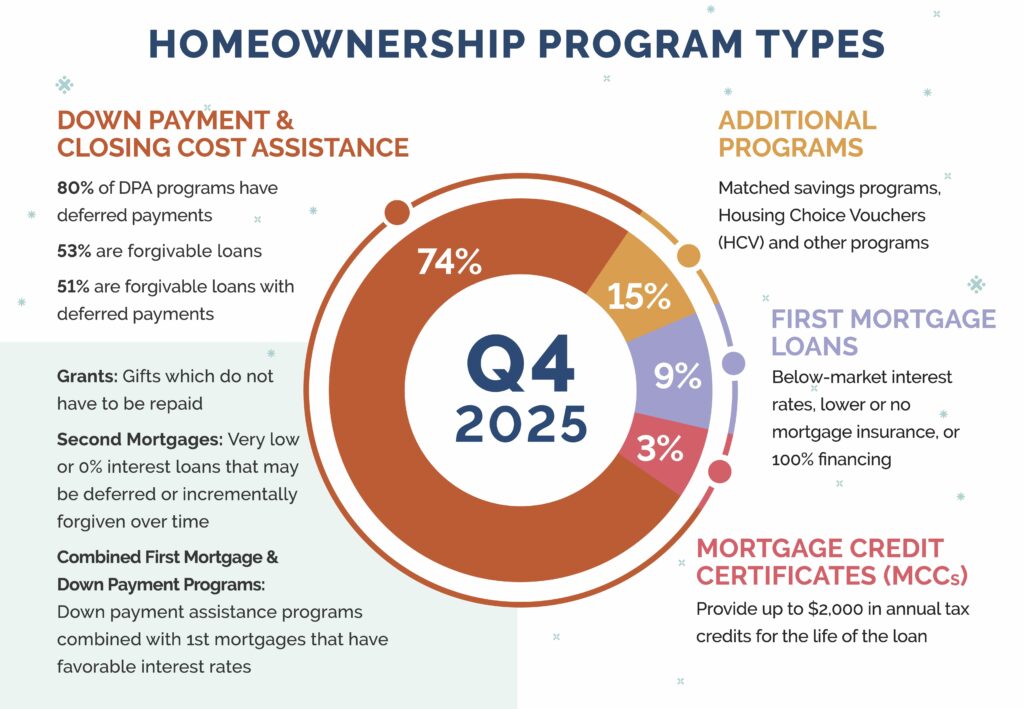
Overall, the breakdown of homeownership programs available by type changed slightly from the previous year.
A complete, state-by-state list of homeownership programs can be viewed here. You can also download the full infographic.
Down Payment Resource builds tools that help mortgage lenders, real estate agents, multiple listing services and consumer listing sites build relationships with homebuyers by connecting them with the down payment help they need.
To learn how Down Payment Resource can help you support homebuyers, contact us.
Methodology
Published quarterly, DPR’s HPI surveys the funding status, eligibility rules and benefits of U.S. homeownership programs administered by state and local housing finance agencies, municipalities, nonprofits and other housing organizations. DPR communicates with over 1,300 program providers throughout the year to track and update the country’s wide range of homeownership programs, including down payment and closing cost programs, Mortgage Credit Certificates (MCCs) and affordable first mortgages, in the DOWN PAYMENT RESOURCE® database.